2020 전산통계학 5차 과제 - integral, uniroot, z-test
코딩 공부/R-전산 통계학 2020. 10. 27. 10:001번) R을 사용하여 다음 세 문제를 적분하시오


library(pracma)
# 1-(1)
f <- function(x) {1/ ((x+1)*sqrt(x) )}
integrate(f, lower=0, upper=Inf)$value
# 1-(2)
g <- function(x) {(1/sqrt(2*pi)*exp(-(x^2)/2))}
integrate(g, lower=-1.96, upper=1.96)$value
# 1-(3) ; tri integrate
sm <- function(x,y,z) {(2/3)*(x+y+z)}
integral3(sm, 0, .5, 0, .5, 0, .5)
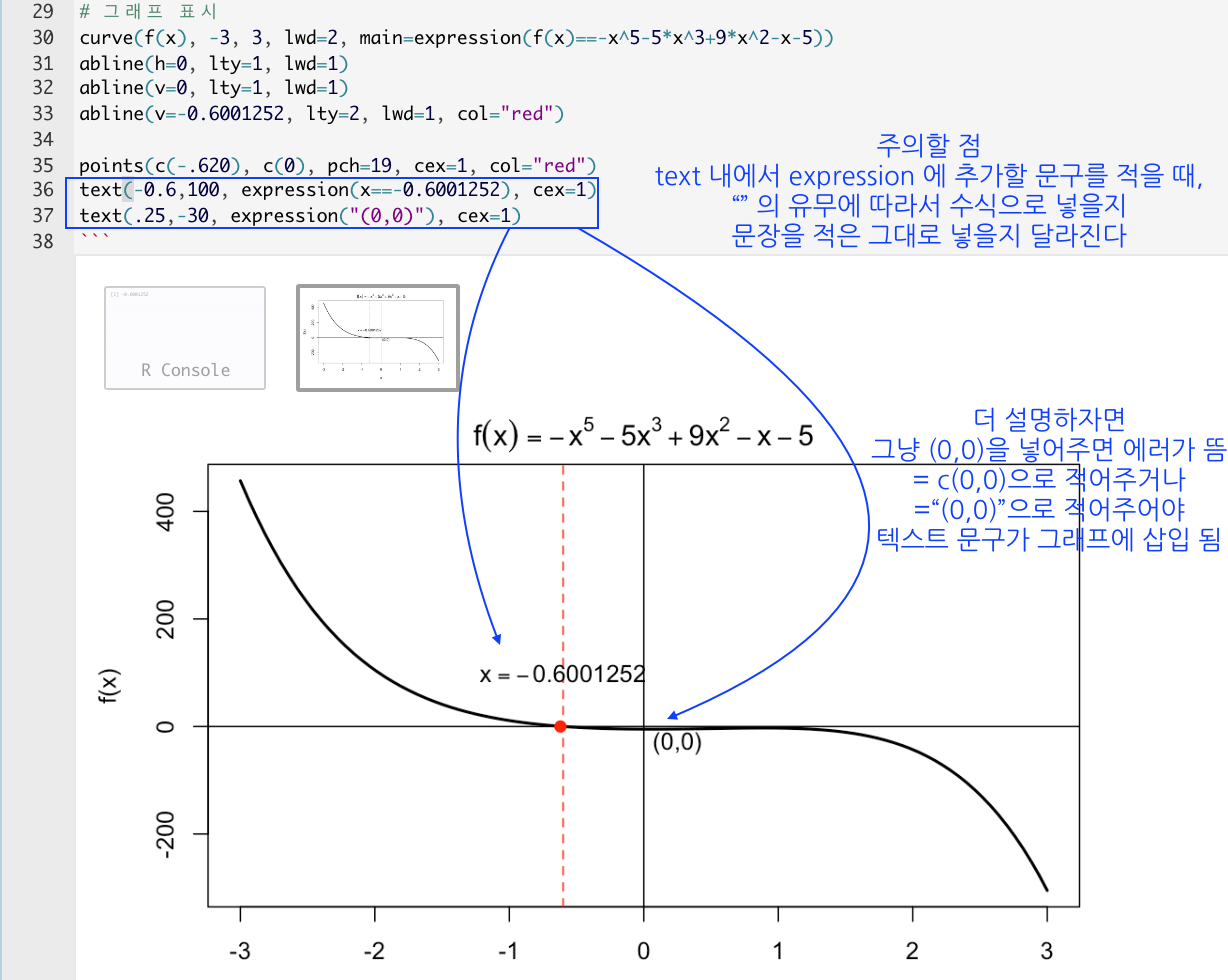
2번) f(x)=-x^5-5x^3+9x^2-x-5 의 -3에서 3까지 그래프를 그려서 근의 위치를 대강 파악하고,
uniroot명령어를 사용하여 정확한 근을 구하시오

f <- function(x) {-x^5-5*x^3+9*x^2-x-5}
# -3~3 사이의 근 찾기
uniroot(f, c(-3, 3))$root
# 그래프 표시
curve(f(x), -3, 3, lwd=2, main=expression(f(x)==-x^5-5*x^3+9*x^2-x-5))
abline(h=0, lty=1, lwd=1)
abline(v=0, lty=1, lwd=1)
abline(v=-0.6001252, lty=2, lwd=1, col="red")
points(c(-.620), c(0), pch=19, cex=1, col="red")
text(-0.6,100, expression(x==-0.6001252), cex=1)
text(.25,-30, expression("(0,0)"), cex=1)
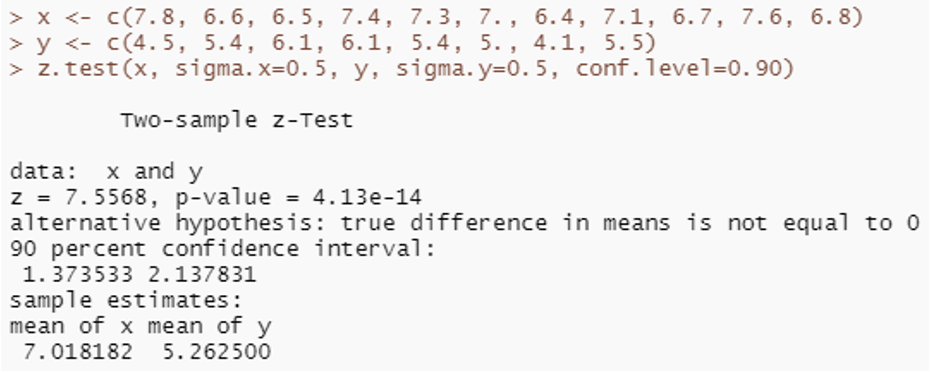
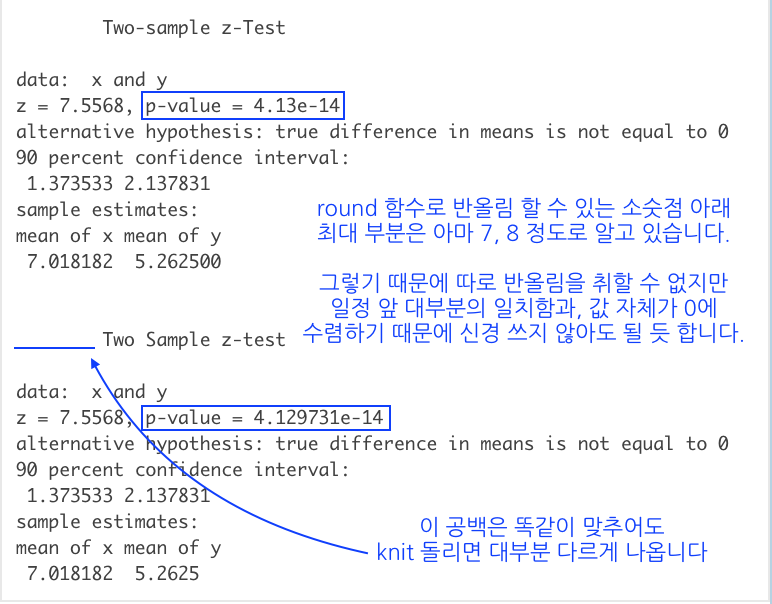
3번) BSDA 패키지 내에 있는 z.test 명령어를 사용하여 구한 two-sample z test 결과입니다. z검정을 할 때 배웠던 수식들을 사용하여 검정색 글씨부분과 똑같은 결과를 만드는 프로그램을 만드시오
(데이터_1, 데이터_2, σ_1, σ_2, aplpha(conf_level : 유의 수준) 들을 변수로 사용하시오)

library(BSDA)
x <- c(7.8, 6.6, 6.5, 7.4, 7.3, 7.0, 6.4, 7.1, 6.7, 7.6, 6.8)
y <- c(4.5, 5.4, 6.1, 6.1, 5.4, 5.0, 4.1, 5.5)

# make f.t
smz <- function (data1, data2, sigma1, sigma2, conflevel) {
# z_statistic
zstat <- ((mean(data1)-mean(data2)) - (0-0))/sqrt(((sigma1)^2/length(data1)+((sigma2)^2)/length(data2)))
# p-value
ifelse(zstat<0, pvalue <- 1-pnorm(zstat, lower.tail = T),
pvalue <- pnorm(zstat, lower.tail = F))
pvalue <- pvalue*2
# C.I
ub <- (mean(data1)-mean(data2)) - qnorm((1-conflevel)/2)*sqrt(((sigma1)^2/length(data1)+((sigma2)^2)/length(data2)))
lb <- (mean(data1)-mean(data2)) + qnorm((1-conflevel)/2)*sqrt(((sigma1)^2/length(data1)+((sigma2)^2)/length(data2)))
# result (hypohersis)
result <- "alternative hypothesis: true difference in means is not equal to 0"
# make sentence equal to z.test (in R)
cat("\n Two Sample z-test\n\ndata: x and y \nz = ",round(zstat,4),", p-value = ",pvalue ,
"\n",result ,"\n", (conflevel)*100 , " percent confidence interval:\n ", lb," ",ub,
"\n", "sample estimates:\nmean of x mean of y \n", " ",mean(x)," ", mean(y) , sep = "")
}
z.test(x, sigma.x=.5, y, sigma.y=.5, conf.level = .9) ; smz(x,y,0.5, 0.5, 0.9)
<과제 총평>
1번 : 지금은 친절하게 적분구간을 제시해주었기 때문에 매우 쉽지만, 보통은 적분구간까지 직접 찾아서 해봐야하는 문제가 많이 나옴
그 예시로 2019 전산통계학 기말고사 당시 1번 문제처럼 주어지는 경우 : smbar.tistory.com/72?category=814595
전산통계학, 2019 기말고사
해당 답에 있는 이름은 지정되어 있는 답안이 아닌, 다양한 여러가지의 답들 중에 가장 깔끔한 답을 적어주셨던 당시의 선배님들 이름이니, 따로 크게 연연해하지 않으시길 바랍니다. 1번) 지정
smbar.tistory.com
2번 : 일반적으로 plot을 잘 다룬다면 그래프 표시, 그래프 추가 같은 2번 문제는 쉬움
3번 : "R 내부의 함수가 있는데 뭐하러 고생해서 이 결과랑 똑같이 만드냐?" 라는 생각을 할 수 있겠지만, 오히려 그 함수를 만드는 과정에서 각 test에 쓰이는 수식이나 알고리즘이 의외로 머릿속에서 강하게 남아있음;; 도움이 많이 되는 유형의 과제임
그런데 이번 3번 문제에서 주의해야 할 점은 # result (hypohersis) 이 부분
원래대로라면, 지금은 결론을 아예 "alternative hypothesis: true difference in means is not equal to 0"" 로 고정해버렸지만 두 개의 결론으로 ifelse 같은 조건문을 사용하여 나누어 주는 것이 옳습니다. (직접 생각해봅시다) 또한 변수에 μ_0 또한 주어져서 "~equal to", μ_0 와 같이 설정해주는 것이 올바른 프로그램 구조
 TAG
TAG


